How does Ohio compare to the rest of the Midwest?

Earlier this week, Scioto Analysis released a new report on Human development in Ohio. For this project, we partnered with students from Ohio State University to collect data on income, education, and health across Ohio in order to see how well Ohioans are doing across the state. 

The Human Development Index works by creating indexes for income, education, and health then estimating the average of the three as the final result. 

The closer the Human Development Index value is to one, the closer that state is to the maximum value for that indicator (e.g. the closer Ohio’s median income is to the maximum median income in the US). This suggests high overall levels of income, education, and health. Conversely, the closer it is to zero, the closer it is to the minimum values for income, education, and health.

Human development decreased during the pandemic

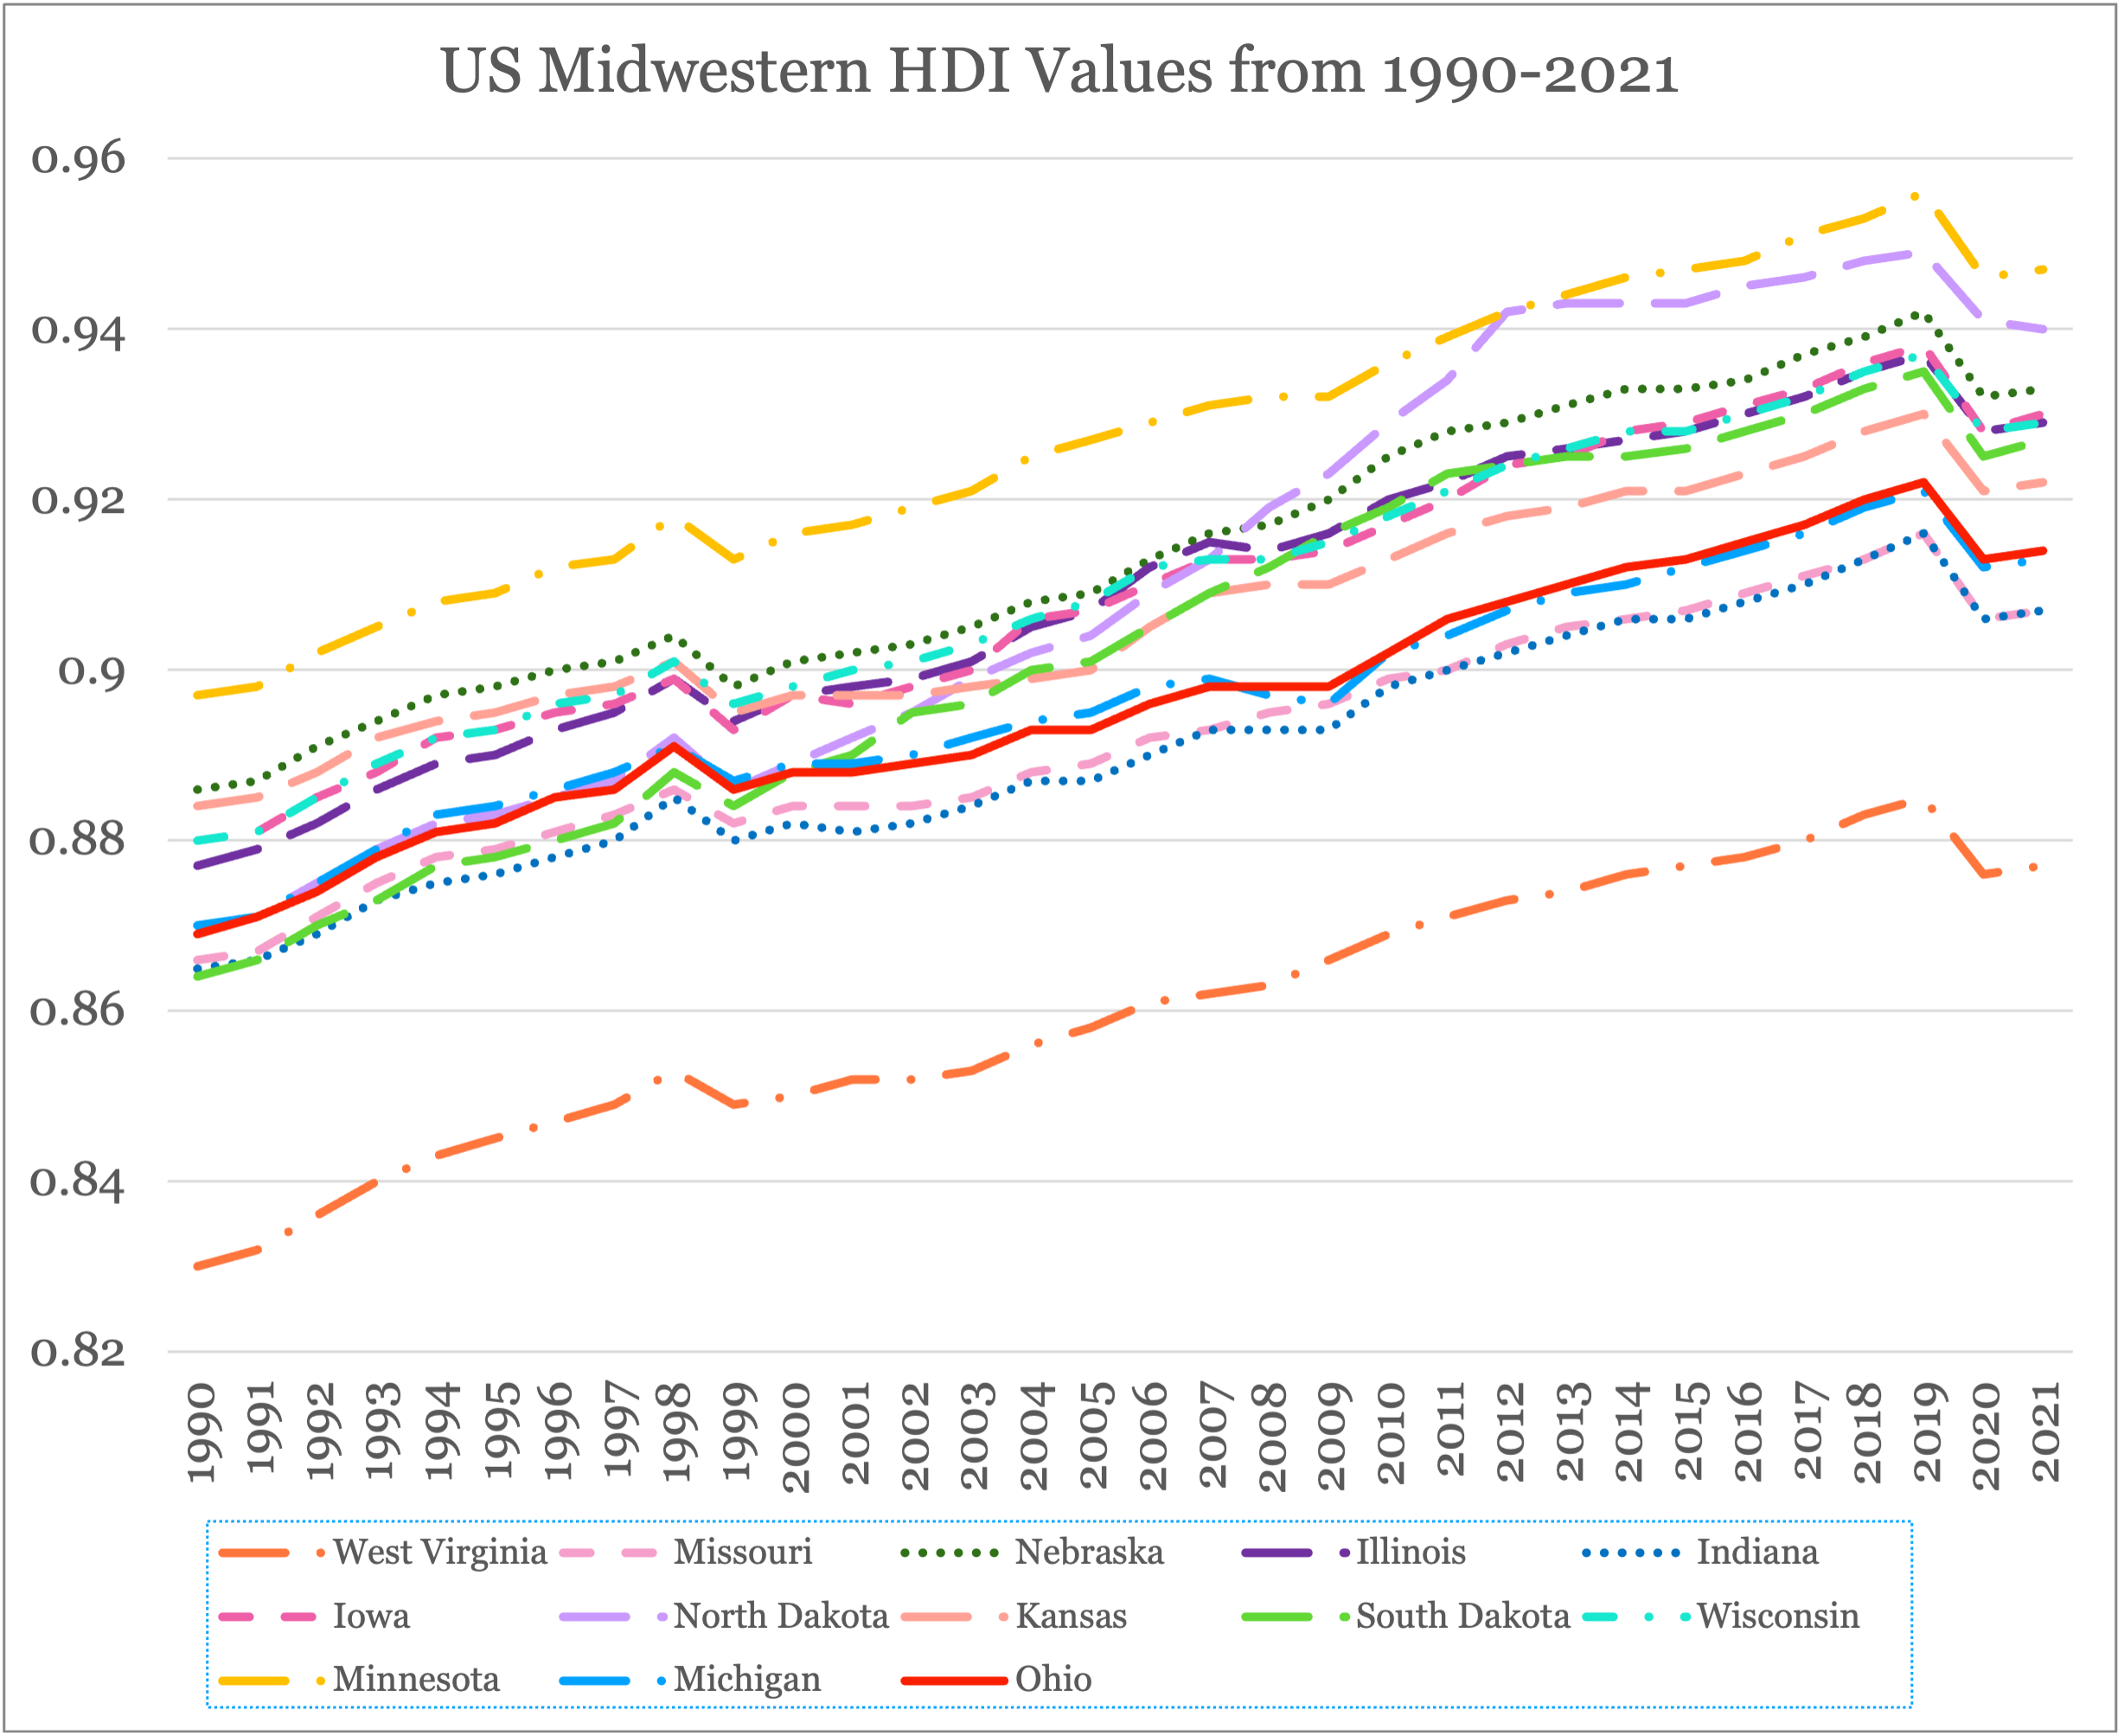
From the chart below, we can see that overall, human development has increased in Ohio since 1990. The main exception is a slight drop in 2020, where the indicators for health and income fell noticeably. The result is that human development as a whole was lower during the pandemic.

Much of this fall was driven by a drop in the health indicator. This indicator is based on life expectancy, so it should be unsurprising that it fell during the pandemic. Additionally, we see a slight decrease in the income indicator, likely due to the recession sparked by COVID-19. Again, the pandemic is certainly to blame. 

Looking forward, we can see that the biggest area for improvement in Ohio is in the health indicator. We should expect some catch-up effect as we become further removed from the pandemic, but even then it stands out as an area that policymakers could address. 

We might also expect the pandemic to have a delayed effect on education outcomes. The education component of the human development index is derived from two data points: the average years of schooling for adults and the expected years of schooling for young children. 

We know that the pandemic has resulted in decreased test scores across the country, but it is unclear how that will translate into future pursuit of education. Our recent study on school spending suggests that lower test scores may decrease the number of people who attend college.

Other Midwest states

Another takeaway from the report is that Ohio lags behind many of its neighbors when it comes to the Human Development Index. Currently, only Kansas, Missouri, Indiana, and Michigan rank lower than Ohio within the Midwest region. 

Much of the Midwest has followed the same trend line as Ohio. A steady increase, with dips around 1999, 2008, and most recently 2020. One thing that has remained constant is the gap between states. 

This is somewhat surprising, mostly because of how close these states are to the maximum value already. I initially suspected that because there wasn’t much room for the states at the top to improve, we would see the states near the bottom catch up. I still think there will be diminishing returns at some point (there is a ceiling on the Human Development Index), but it will be interesting to see how close to one these states can get before they start to taper off.

Landmark study evaluates human development in Ohio

This morning, Scioto Analysis released a study on human development within the state of Ohio. Analysts analyzed and created a Human Development Index for both the nation and counties in Ohio and a demographic analysis of Ohio using data from the Global Data Lab, the American Community Survey, and the Bureau of Economic Analysis.

Analysts found that the country as a whole has been trending positively in terms of human development. Each state has improved its human development index score to some degree over the past three decades. Ohio, itself, has improved from an index value of 0.87 to 0.91. However, when looking at the Midwest, Ohio has ranked in the bottom 25% for the past two decades.

Human development is calculated as a function of income, health, and education levels within the state, each given an equal weight. This measure is based on international standards of evaluating human development.

The data showed the negative the COVID-19 pandemic had on human development as every state saw a dip in its human development during 2020. This trend was similarly echoed in the data for Ohio counties. 

Analysts created a 3-year time series of Ohio Counties’ HDI which, similar to the national trend, showed overall improvement over the 3 years. Counties in Southeastern Ohio had the lowest HDI while northwestern counties held some of the highest. Rural counties with low populations tended to have lower HDI scores than their metropolitan and suburban counterparts.

Delaware County, the suburban neighbor of the metropolitan Franklin County,  consistently ranked as the highest county with HDI scores above 0.98. 

Demographic measures of the HDI components also revealed interesting trends. Asian Ohioans had the highest percentage per population of attaining a bachelor’s degree or higher. African Americans living in Ohio consistently earned the lowest average income, nearly $30,000 less than their Asian counterparts who are the highest earners in the state. Hispanics in Ohio lived on average 2 years longer than White Ohioans and 4 years longer than African American Ohioans. 

The report hopes to spur demand for strategic policy change that better addresses both the racial and geographic inequalities in Ohio and is a part of a larger project Scioto Analysis is conducting, looking into the well-being within Ohio.  

New research bodes well for paid parental leave

Last month, my colleague Michael Hartnett and I attended the Association for Public Policy Analysis and Management’s Fall Research Conference in Atlanta, Georgia. He and I have been doing a bit of work with the Rise Together Innovation Institute on paid leave family policies so Michael attended a few sessions on the effects on paid leave programs.

The researchers at this leading public policy research conference focused most squarely on proximate impacts of paid family leave: who takes leave, impacts on the gender wage gap, and impacts on firms.

While these impacts are important, they tell us little about the most promising aspects of paid family leave: the impact on children of having the individualized attention that paid leave facilitates.

Nobel Prize Winner James Heckman argues educational investments in very young children have higher yields than educational investments in older children and much higher yields than investment in adults. If he is right, that means paying parents to stay home with very young children could yield even higher benefits than already very-effective investments like high-quality early education for three- and four-year-olds.

As we puzzled over the lack of research on long-term impacts presented at APPAM, our prayers for evidence were answered. Just last month, researchers from the University of North Carolina at Chapel hill, Washington University at St. Louis, and the Brazilian School of Economics and Finance released a working paper on the intergenerational impacts of paid family leave.

These researchers used 40 years of survey data covering two generations coinciding with changes in paid family leave policies to see how these changes in leave policies impacted children’s outcomes down the road.

One impact these researchers found was on education and wages for children. Children born under policies that protected leave for parents ended up having higher levels of education and wages than children who did not.

The researchers also found an intergenerational mobility impact of paid leave policies. Children of mothers with lower levels of education tended to have more education if their parents lived under a protected leave policy than children with parents who did not.

Researchers also found that parents under protected leave policies tended to spend more time with children and increase spending on child care for children. This suggests that protected leave policies may have led to more parental investment in children, leading to better educational and labor market outcomes for children.

The researchers also found drawbacks to the protected parental leave policies. They found the “motherhood penalty” of lower wages for mothers was exacerbated under these policies. They also found the policy increased the chance of having a first child but decreased chances of having a second child in the family.

Many municipalities in Ohio are moving forward on paid family leave. In 2016, Cleveland suburb Newburgh Heights made national news when it passed a 6-month paid leave policy for employees–reported as the most progressive in the country at the time. Since, Cleveland, Columbus, and other cities across Ohio have passed paid family leave policies for employees. Even the state of Ohio quietly expanded paid family leave in its most recent budget.

Paid family leave seems like a good benefit for new parents, but it is an especially promising intervention for children. Ensuring parents can give individualized attention to children at the most crucial stage of development could have impacts that cascade across the generations.

This commentary first appeared in the Ohio Capital Journal.

Five impacts of increased school spending

Earlier this week, Scioto Analysis released our most recent cost-benefit analysis. This time, we took a look at how increasing or decreasing school spending would impact Ohio’s students. School spending, like many other policy options that invest in young people, often have far-reaching effects. 

Today, I wanted to look over five of the main effects that come with increased school spending. 

Test scores

The most direct effect of increasing school spending is that it improves the academic performance of students in the form of higher standardized test scores. While a test score is not in and of itself a tangible benefit to our society, higher test scores are correlated with other benefits.

Despite the fact that standardized test scores are a blunt way of measuring any individual’s intelligence, we should expect that, all else being equal, raising test scores in the aggregate is a good thing. It is a sign that on average, students are gaining some amount of human capital that will make them better prepared for their adult lives.

Increased graduation and college matriculation

Researchers have found that increasing per-student spending during elementary and high school leads to higher rates of high school graduation and college matriculation. Functionally, this outcome is very similar to increased test scores. 

From a human capital perspective, these effects have a much greater impact on an individual’s future employability. They can also have the impact of signaling human capital to employers in way that test scores would not on their own. Although these effects take a long time to start accruing benefits for society, we certainly expect that these early investments are worth it.

Increased wages

Higher graduation rates and college matriculation should lead to higher wages. This means students who are exposed to increased spending early on are expected to have higher wages as adults. These higher wages can significantly improve the quality of life for the people who earn them.

Additionally, the rest of society also benefits from these people earning more. An increase in wages means more income tax revenue for the government. If allocated efficiently, these new public resources can lead to even larger benefits for society as a whole. 

Lower social costs

Another effect of people earning more is that they will be less reliant on other forms of non-wage income to get by. Researchers have found that people who graduate from high school are less likely to use government assistance programs, meaning resources can be allocated elsewhere to people who need them. 

Additionally, researchers have found that high school graduates are less likely to be incarcerated. This means increasing the rate of high school graduation can lower direct costs in the criminal justice system, and prevent social costs associated with crime.

Intergenerational effects

Although our cost-benefit analysis did not address intergenerational effects, these could have a large impact on society as well. New research now confirms that increasing wages in one generation can significantly affect the lives of the next generation. 

This means that the benefits from a policy like increased school spending can pay dividends for decades beyond those when the initial spending takes place. Investments that have intergenerational effects can be some of the most valuable policy options from a social perspective. They require patience, but their returns are often worth it. 

Increased school spending could pay off for Ohio

Today, Scioto Analysis released a new study measuring the economic impact of changes in K-12 school spending. We found that if Ohio increased its school spending from its current 2023 spending to more closely model Pennsylvania’s level of spending, (about a $2,800 increase per student), the state could see net economic benefits ranging between $23 and $90 billion. A reduction in spending that models the K-12 spending of Indiana (about a $3,500 decrease per student) would create economic losses between $30 and $120 billion. 

The most significant impact of changes in school spending would be its impact on college matriculation. Increasing school spending contributed to an increased number of high school graduates pursuing higher education. From an increase in spending, we project that there would be an estimated additional $18 billion in benefits, and a loss of $23 billion with a decrease in spending. 

If a change in K-12 spending in Ohio was designated in a way that prioritized funding low income schools, the estimated overall benefits from an increase in spending would be $46 billion as opposed to around $40 billion, and the losses from a decrease in spending would be around $46 billion as opposed to $50 billion. 

In addition to college matriculation, other factors that are influenced by changes in K-12 spending are test scores, high school graduation, and social savings from reductions in crime and welfare reliance. 

This year, Ohio is currently ranked 19th in the nation for its per-pupil K-12 spending. However, a new federal budget approved in July for 2024 and 2025 designated a total of $12.97 billion for K-12 spending, an 11.4% increase. 

This study is part of a series of cost-benefit analyses conducted by Scioto Analysis. Previous cost-benefit analyses were conducted on recreational marijuana, daylight saving time, child tax credit, harmful algal blooms, and urban canopy programs. All previous cost-benefit analyses can be found on the Scioto Analysis website.

Ohio Department of Education leading quiet policy analysis revolution

Last month, I attended the Association for Public Policy Analysis and Management’s Fall Research Conference. This is the ultimate wonk conference — more than 2,000 policy analysts and researchers convening in Atlanta, Georgia to talk about the most recent research on topics of public policy.

I go to this conference because I’m interested in what people are learning about public policy across the country. I’m often interested in learning things that I can bring back to Ohio — new analysis being conducted that is not happening here in the Buckeye State. Ohio isn’t usually on the cutting edge of policy analysis, so this is a good place for me to learn about things I can bring back home.

Imagine how surprised I was when I saw one of the most innovative research projects in the country presented by the Ohio Department of Education.

If you follow Statehouse news, you likely have heard about the efforts to reform education finance in Ohio. Alongside these legislative reforms, which will likely lead to billions of dollars in changes for school funding in Ohio, the state Department of Education (newly changed to the “Department of Education and Workforce”) has been conducting a series of studies on the cost of education in Ohio.

Two of these studies were released late last year. 

In November 2022, the Department of Education released a study by the American Institutes for Research on the cost of adequate special education in the state of Ohio. A month later, the Department released a study by West Ed and APA on the cost of education for English language learners in Ohio.

What I found fascinating about these studies was the approach they took. The studies were focused on a similar question: what will it cost to provide an adequate education for key student subgroups? They then answered these questions by turning to Ohioans.

Each of these studies included both interviews and surveys with professionals across the state to understand the components needed in education and the costs associated with these components. They both also undertook a “professional judgment panel” approach that utilized panels of local experts to understand the resources needed to provide education and the cost of those resources.

The Department of Education and Workforce is now contracting a new study, this time focusing on economic disadvantage, a component of school funding that could have a wider research than the last two studies.

While the Department has not officially endorsed the findings of these reports, they commissioned them in order to make sure that policymakers had access to the best information possible when formulating school funding policy.

Whether the General Assembly incorporates the results of these findings into future education budgeting is yet to be determined. We still live in a democracy, so it is not technocrats who make these decisions, it is elected officials who do. 

That being said, these sorts of studies represent a triumph for evidence-based policymaking and a marrying of the ideals of rational policy analysis and local input. Often Ohio is the last to undertake innovations in policy, but this is a situation where Ohio is leading the way. And as a state, we should be proud of that.

This commentary first appeared in the Ohio Capital Journal.

Effects of paid family leave policies

Paid family leave is one of the most commonly discussed topics among policy wonks in the US, which is why at the Association for Public Policy Analysis and Management conference there were six unique sessions on the topic. One of the reasons there is such a staggering amount of research on this topic is because access to leave after birth of a child or adoption can have such a wide range of outcomes for parents and children. 

In our research, we’ve almost exclusively focused on paid family leave as an anti-poverty policy. However, at this conference few researchers were focused on the poverty implications. Although I was slightly disappointed I couldn’t learn more about the impact that was most relevant to our work, this was a great opportunity to better understand some of the other most important outcomes paid family leave has.

Who actually takes leave

One interesting finding from multiple researchers was that paid leave was taken by high-income families more than low-income families. This was initially surprising to me because I assumed that these families with additional resources would choose to pay for child care and remain in the workforce to presumably increase their odds of career advancement. 

What I overlooked and what these researchers uncovered was the fact that paid leave almost never fully replaces an individual’s wage. A paid leave policy might cover 50% - 80% of someone’s salary for a few weeks. The result of this is that low income workers who are eligible for paid leave actually can’t afford to take it. High-income households have more capacity to absorb this short-term reduction to their income than low-income households. The partial loss of income is too severe for low-income mothers to maintain and they are forced to go back to work much sooner than upper-income mothers.

The gender wage gap

Another gap between intuition and reality, I expected paid leave policies to help shrink the gender wage gap, the logic being that women are better able to stay attached to the work force and earn higher wages as a result. In reality, multiple researchers found that family leave policies were associated with a stagnation in the gender wage gap. 

In short, the gender wage gap was shrinking during the 70’s and 80’s as more women entered the workforce, but this effect stalled once states began introducing family leave policies (these were largely unpaid leave policies). The researchers concluded that this stagnation was not because these policies could be thought of as benefits that only women received. While I don’t think the correct conclusion from this result is that paid leave policies are actually sexist, it is important to remember that paid leave isn’t a silver bullet when it comes to equity in the workplace.

Firm effects

One paper presented at the conference was focused on the way that firms responded to paid leave policies. Specifically in the context where firms were faced with a new payroll tax that the government would use to subsidize family leave when it was taken. 

They found that firms largely fell into three categories. First, large employers were essentially unaffected. For these companies with hundreds or even thousands of employees, neither the additional tax nor the temporary loss of an employee were particularly harmful. 

Second, small businesses were actually hurt by these policies. They were sometimes unable to deal with either the tax or the temporary loss of an employee. This is an important reminder that policymakers should be thinking of ways to balance out the potential downsides of policies like this. 

Finally, firms that have large percentages of female employees actually felt this policy as a subsidy. The payroll taxes were offset by the additional benefit their employees were receiving.

We all hope paid family leave can be a way to level the playing field for families. But effects can go different ways in the short-term. Good public policy will help ameliorate these problems to ensure that young children can spend time with parents, furthering their development and helping them escape cycles of intergenerational poverty.

When is cost-benefit analysis not enough?

Earlier this month, I was at the Association for Public Policy Analysis and Management conference, where I participated in a community discussion about economic evaluation of public policy. During this conversation, we talked about the differences between evaluating effectiveness, efficiency, and equity of public policies. 

It would be amazing if the most effective policies were also always the most efficient and equitable, but in reality we are faced with tradeoffs between these three goals. Do we prefer an efficient policy that only works on a small scale, or will policymakers stomach losing some efficiency to increase the magnitude of the result? What about a policy that is less effective overall, but does a lot more to improve equity–is this a tradeoff we would accept?

In cost-benefit analysis, one of the most important techniques for efficiency analysis, there is sometimes a desire to incorporate elements of equity analysis into the model. For example, if we include some measure of the diminishing marginal utility of income in a model, then whatever analysis we do will by default begin to suggest that more equitable outcomes (in this case those with less income inequality) are more efficient. Dan Acland, an economist from Berkely, has presented research on this topic at the annual Society for Benefit-Cost Analysis conference.

This begs the question, is it possible for cost-benefit analysis to go beyond efficiency analysis and also act as a tool for equity analysis?   

One of the main concerns with attempting to include criteria other than efficiency into cost-benefit analysis is the difficulty that comes with trying to monetize equity impacts. Monetization is often one of the most challenging parts of cost-benefit analysis, and the further we get from goods that are actually traded in a competitive market the more difficult it becomes to understand how much people are willing to pay for certain things. 

There are plenty of very rigorous ways to determine prices for things that are never actually bought or sold. Returning to the marginal utility of money example, economists have spent a lot of time researching and as a result we have a pretty good understanding of how valuable money is to different people. 

Instead, if we were talking about how much people would be willing to pay to avoid experiencing racism, we would have a much more difficult time coming up with a reasonable monetary value. Maybe you could connect it to people’s willingness to pay for things like home security somehow, but that would clearly be a weak connection. Monetization of impacts is a great strategy for estimating efficiency, but it is not necessarily the best way to measure effectiveness or equity.

More importantly, it probably isn’t appropriate to ask the question how much are people willing to pay to avoid experiencing racism. Cost-benefit analysis is really good at measuring efficiency, but there is no reason to expect it to be able to handle big questions of morality.

What does all of this mean for cost-benefit analysis? I believe that cost-benefit analysis should monetize equity outcomes when it makes sense while still recognizing that it is not a form of equity analysis. 

I think it makes sense to model the marginal utility of income in cost-benefit analysis because money can be used more or less efficiently by certain people. There are equity implications to that, but at its core the marginal utility of income is a question of efficiently allocating resources. However, saying income inequality is inefficient is not the same as believing we want to live in a society that distributes income more equitably. If we really want to care about the equity implications of policy decisions, then we need to dedicate time and energy beyond cost-benefit analysis.

Ohio economists agree land value tax will encourage property development

In a survey released this morning by Scioto Analysis, nine of twelve leading Ohio economists agreed that replacing property taxes with land value taxes would encourage property development. This is largely due to the fact that property owners would not see increased tax bills after making improvements to their property. In other words, there is no disincentive to additional property development. 

As Curtis Reynolds from Kent State wrote “Theory is quite clear that land taxes are more efficient than property taxes, so switching to land taxes should increase property development. How much that will happen is unclear.” 

Economists were split on the question of whether land value taxes are more progressive than property taxes. In general, property taxes are often regressive, meaning lower income individuals spend a larger percentage of their income on these taxes than higher income individuals. This is because lower income individuals generally spend a greater percentage of their income on housing than higher income individuals.

As Jonathan Andreas from Bluffton University wrote: “The devil is in the details and I don't have all the details, but for urban taxes it seems hard to engineer a land value tax to be less progressive than a real estate tax because poorer people spend a larger percent of their income on housing (which is taxed less) whereas richer people own most of the land (which is taxed more).”

The Ohio Economic Experts Panel is a panel of over 40 Ohio Economists from over 30 Ohio higher educational institutions conducted by Scioto Analysis. The goal of the Ohio Economic Experts Panel is to promote better policy outcomes by providing policymakers, policy influencers, and the public with the informed opinions of Ohio’s leading economists. Individual responses to all surveys can be found here

How to adjust for inflation in social return on investment analysis

The biggest economic story of the past year has no doubt been inflation. As the world has dug itself out of the COVID-19 recession, supply chain gluts and reduced labor supply has driven prices up across the world.

In the United States, inflation peaked at 9.1% in June of 2022, over quadruple the Federal Reserve’s goal of 2% inflation. Inflation has since cooled, dropping to 3% a year later in June of 2023 and staying in that area into the fall of 2023.

This nationwide price whiplash is likely to have an impact on practitioners of cost-benefit analysis and social return on investment analysis. Recently, in some of our work with Ohio University’s social return on investment analysis team, we had some conversation about the impact of inflation on valuation.

Inflation means dollar values can buy different bundles of goods over time. In general, it means that more dollars are needed to purchase the same goods or services as time goes on.

This has an impact on analysis that relies on monetization to compare goods and outcomes against one another. If one study monetizes the value of an outcome in 1990 at $100 and another study monetizes the value of a separate outcome in 2022 at $100, those two outcomes are not the same. The two values need to be brought to the same year value in order to be compared to one another.

Guides to social return on investment do not typically provide a lot of guidance to practitioners on how to incorporate inflation into their analysis. Social Value International’s Guide to SROI does not mention “inflation” throughout the entire document.

We were able to find one guidance document on social return on investment analysis that mentions inflation. New South Wales, Australia’s Department of Communities and Justice Guide to SROI recommends analysts “adjust dated historic values for cost inflation so that they can be compared to contemporary values.”

In response to this dearth of guidance on the use of inflation in social return on investment analysis, we have provided some tips for the practice.

  1. Consider inflation when doing valuation

Whenever a number is reported, identify the year the data was collected. Adjust numbers to bring them in line with the year the social return on investment is being calculated for. This allows apples-to-apples comparisons to be made across time when conducting analysis.

  1. Use the Bureau of Labor Statistics’s Inflation Calculator

The Bureau of Labor Statistics Inflation Calculator is an excellent, reputable tool for estimating the impact of inflation on average prices. To use the tool, set the first number and date based on the source and the final date based on the date the study period applies to.

  1. Include both the original value and inflation-adjusted value in your SROI Model

Transparency is clear when modeling quantitative and monetized impacts of programs in a social return on investment analysis. Include both the original value from the study as well as the inflation-adjustment value in your documentation so people can see how the number was changed using the inflation adjustment.

While this adds another step, it makes the number transparent and easier to verify during data checking. It also makes clear that inflation adjustment happens, helping you to reduce the risk of accidentally doubling the inflation adjustment and making it clear to those who verify the analysis that inflation adjustment took place.

  1. Use alternate inflation measures when appropriate

Some sectors of the economy grow faster than others. If a valuation refers to a sector that has grown faster or slower than the general economy, consider using a producer price index based on that specific industry rather than the consumer price index to more accurately reflect the changes in prices over time. This can make the analysis fall closer to the actual value when a market is being considered that has anomalous inflation over time.

These are just a few tips that can make your use of inflation in social return on investment more rigorous and bring your analysis close to the truth about the value of programs analyzed.