A central theory of labor economics covered in most introductory microeconomics courses is that of the “labor/leisure tradeoff.” This is the concept that workers have time they can spend working and time they can spend doing other things and that they will try to maximize their “utility” by achieving the optimal mix between labor and leisure.
Below is a visualization of the concept. You can plot a wage on a chart like this as a line that runs from the top left to the bottom right and a worker will choose how much to work based on where their wage line intersects the “indifference curve” (the blue lines) that is furthest out. An “indifference curve” represents all the points as which a worker would be “indifferent” to a different mixture between income and leisure.
So a worker is just as happy at being at point A or point B who has the indifference curve IC1, though at point A she has more income and less leisure and point B she has more leisure and less income. Any point to the northeast of IC1 is preferable to any point on IC1 because it means more income and more leisure, less leisure compensated by much more income, or less income compensated by much more leisure.
This is of course a simplification. There are structural frictions in the labor market that can limit a worker from achieving the appropriate mix of labor and “leisure” that she desires. But empirically we do see this phenomenon playing out, with price increases like taxes leading to reductions in labor time in favor of “leisure” time. What I’m more interested in talking about here is something else: what we define as “leisure.”
“Leisure” time is defined by this model as time a worker spends doing something other than generating income. But is all of this rightly understood as “leisurely” activity?
One place we can look to find an answer to this question is the American Time Use Survey. The American Time Use Survey is a nationally representative survey conducted by the Census Bureau to determine how, where, and with whom Americans spend their time. It is the only federal survey providing data on the full range of non-market activities, from childcare to volunteering.
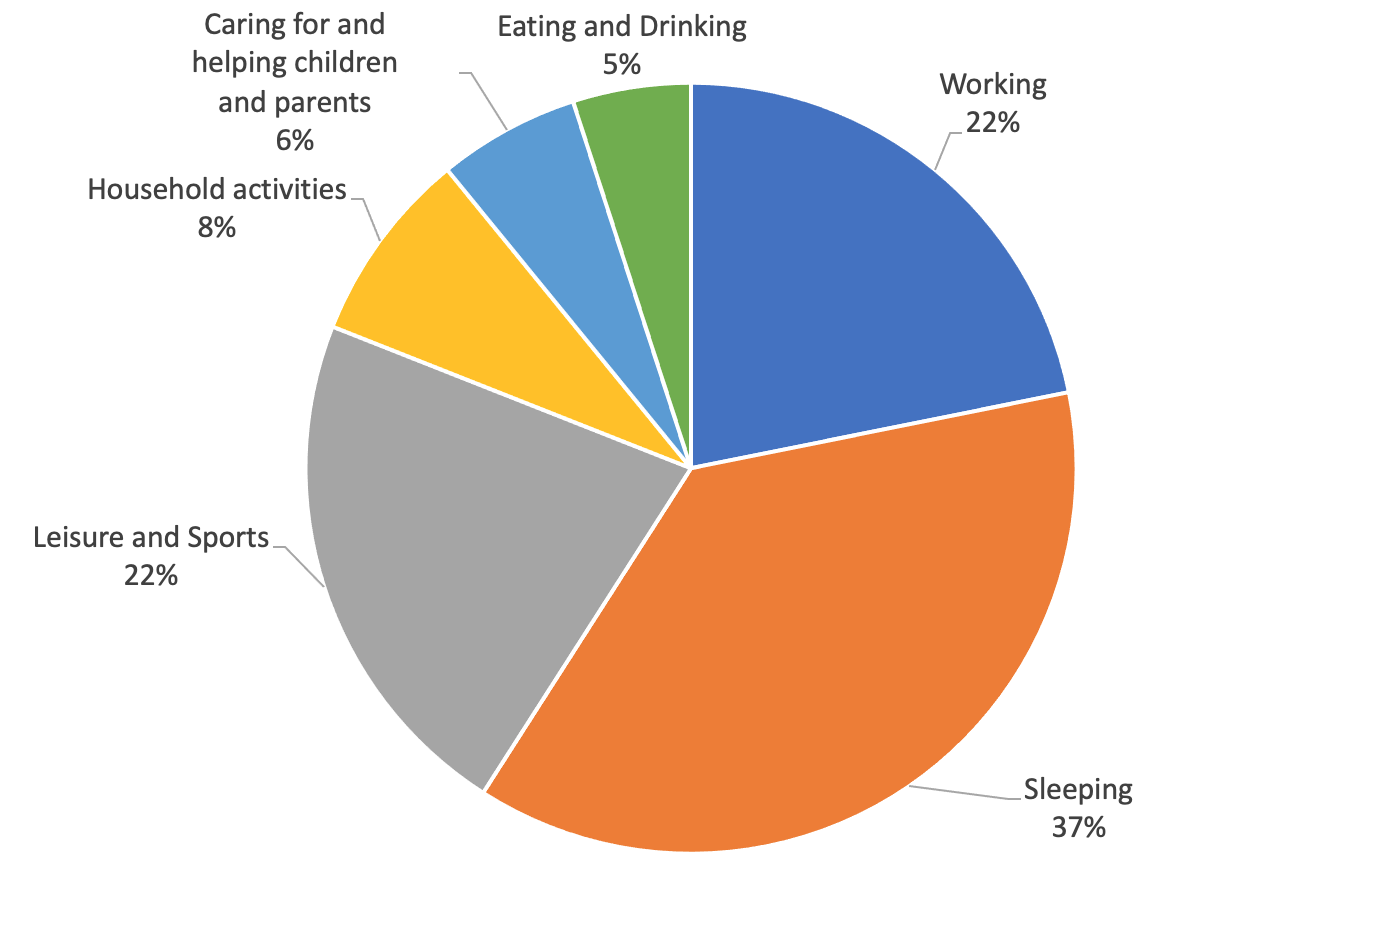
Looking at an overview of how Americans spend their time, the picture of “leisure time” gets a little more complex.
According to 2021 results, Americans spend about 22% of their time on average at work. They spend about 37% of their time on sleeping, 22% of their time on leisure and sports, 8% of their time on household activities (including travel), 6% of their time on care for children and parents, and about 5% of their time on eating and drinking.
So if we look at these results, we find that 42% of total time (54% of what the labor/leisure model calls “leisure time”) is spent on eating and sleeping, activities most people would deem essential to survival. Yes, there is a leisure component to eating and sleeping, but many people’s experience with food and sleep in the United States would not necessarily be called “leisurely.”
Another 14% of total time (18% of “leisure time”) is spent on household activities and caring for family members. This is what many would consider “non-market economic activity”--dollars aren’t changing hands, but they certainly could if these activities were outsourced from the household to a cleaning service, child care agency, or long-term care facility.
This only leaves 22% of total time, or 28% of time not worked, as time for “leisure and sports.” So only about a quarter of what we call “leisure time” is truly spent doing things we consider “leisure.”
When I was in graduate school, our economics professor eschewed the use of the phrase “leisure time” for the phrase “non-market time.” I think this is probably a better way to treat this time we spend sleeping, eating, taking care of family, caring for the house, and on leisure and exercise.


