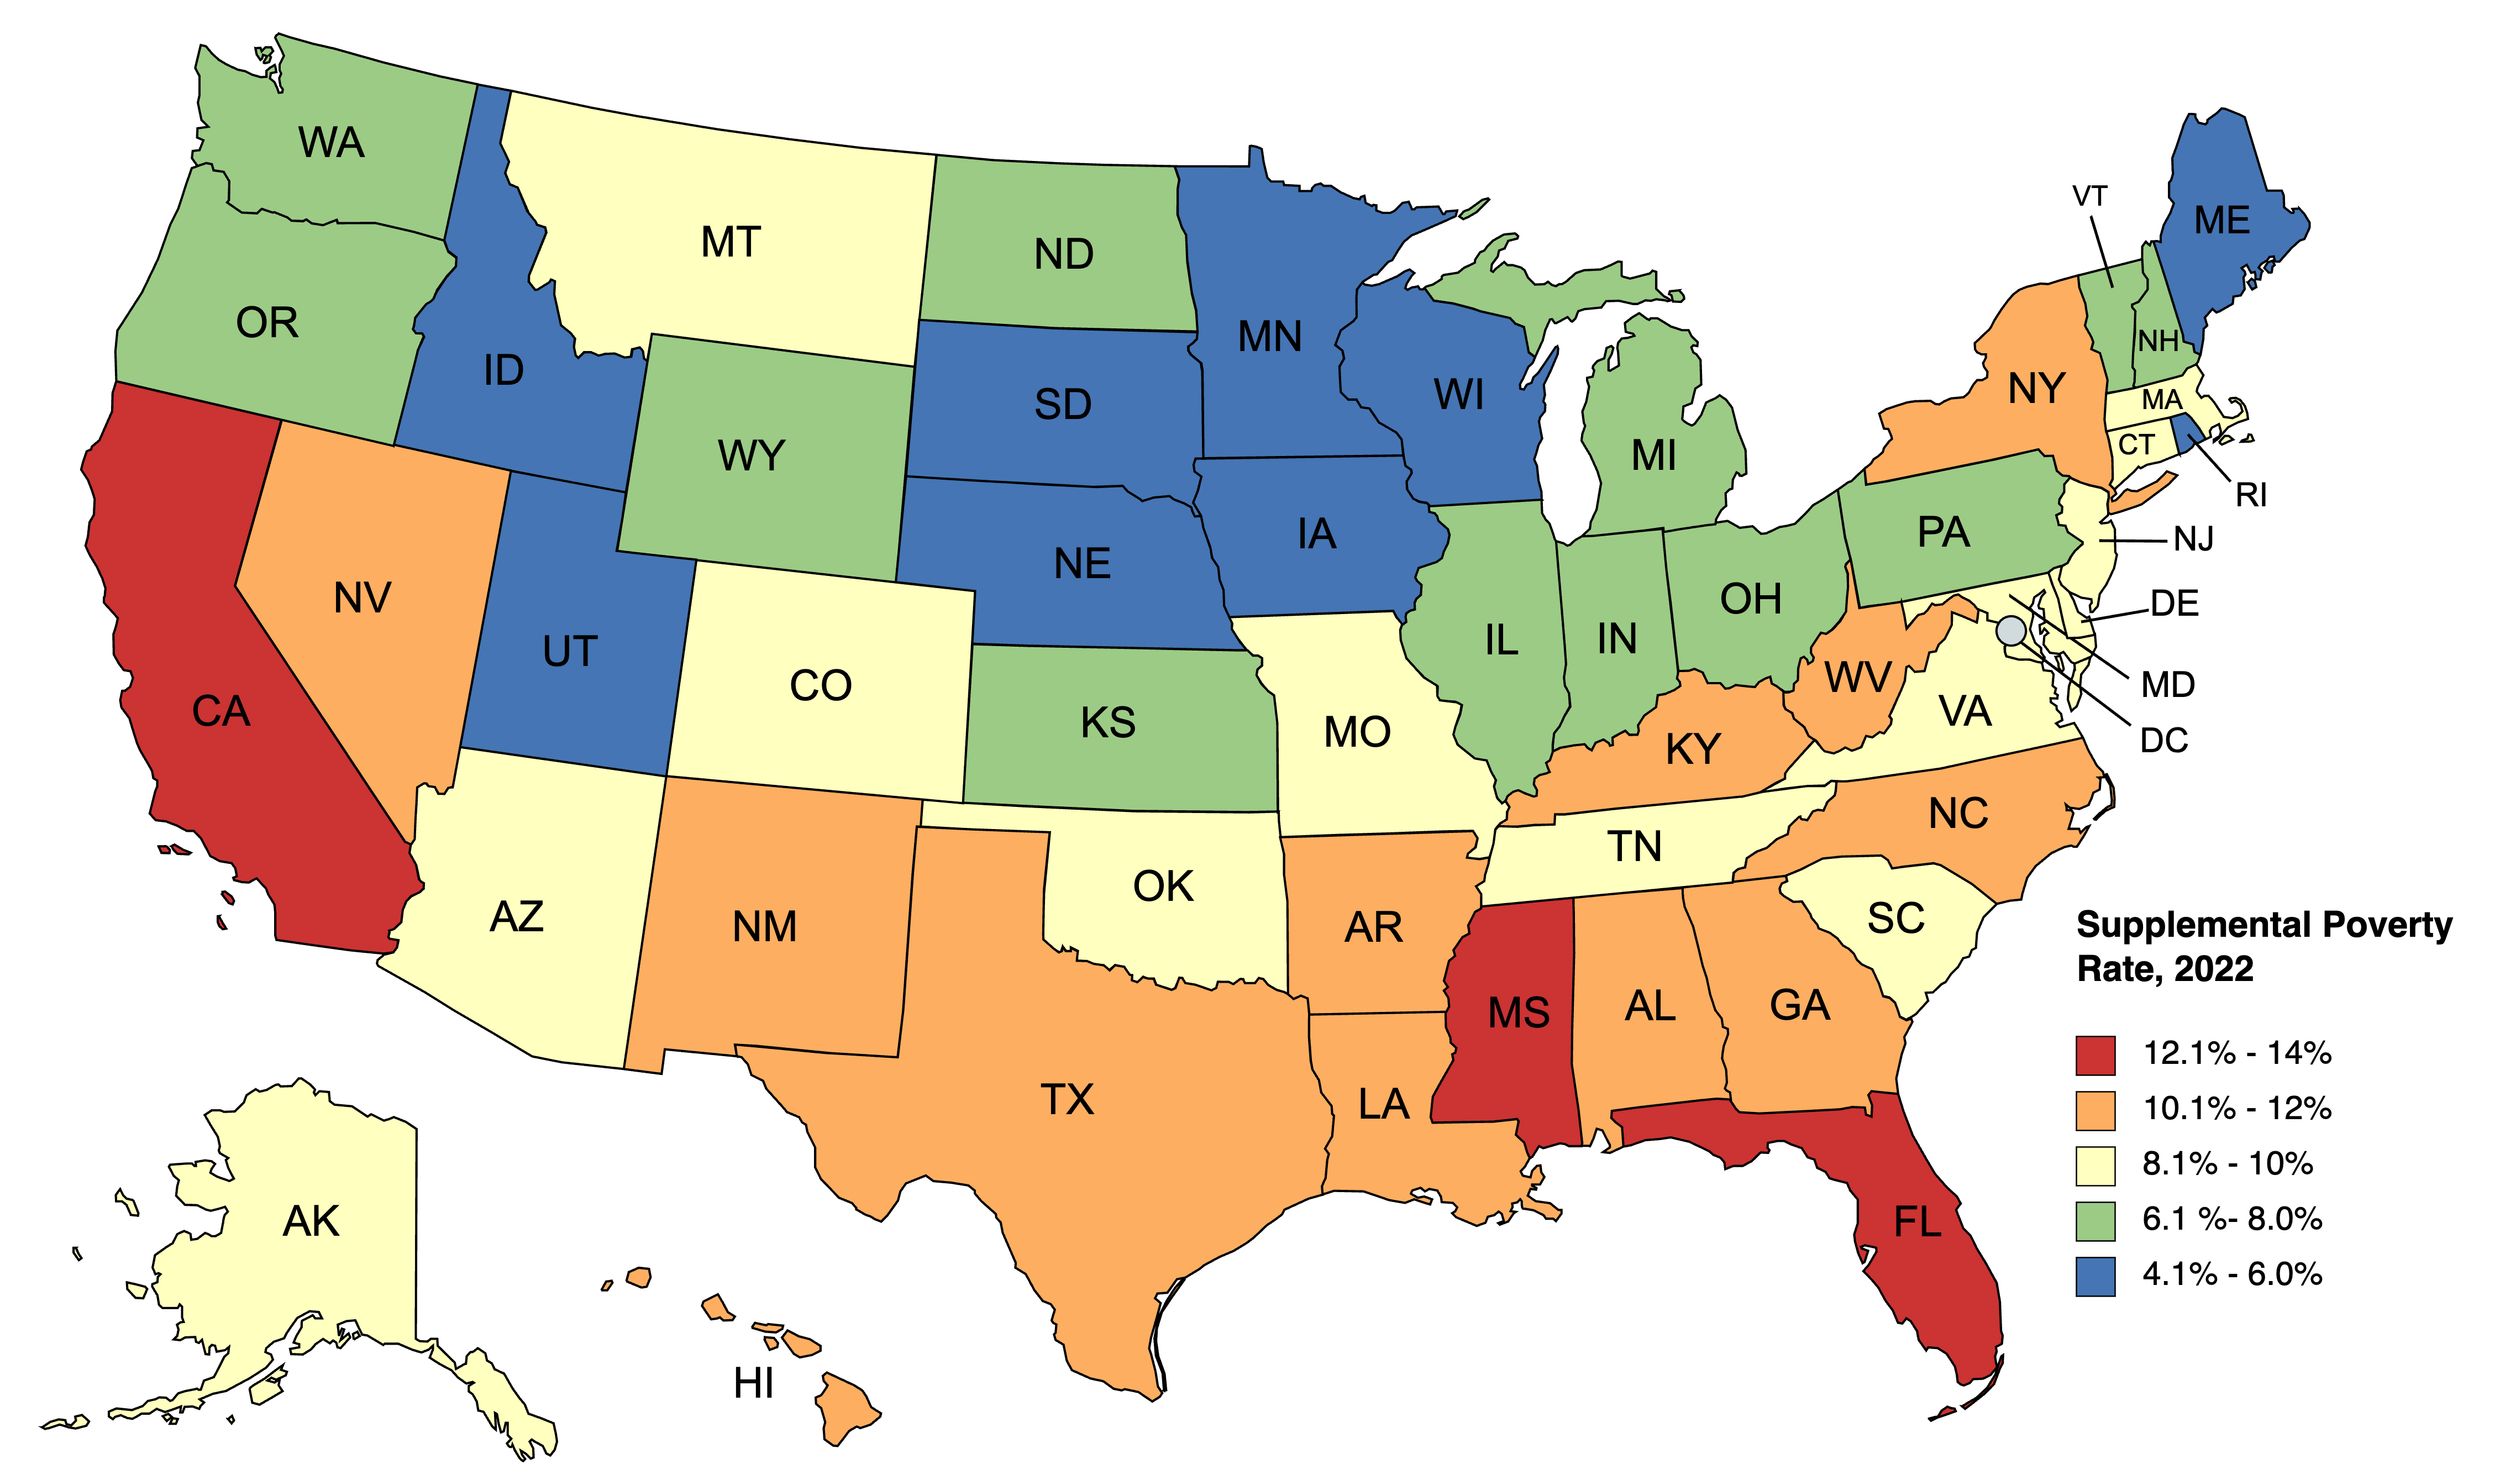
Last week, the U.S. Census Bureau released “Poverty in the United States: 2022,” its annual report on the data the bureau collects on income and poverty in the country.
One of the measures the Census Bureau estimates is the Supplemental Poverty Measure. This is a measure of poverty considered by most poverty scholars to be the most useful measure of poverty because it factors in taxes and benefits and makes adjustments for cost of living.
Below is a map of the fifty states color coded to the percentage of the population living in poverty according to the measure. The national poverty rate is 9.8%, so generally you can think of yellow states as close to the national poverty rate, orange and red states as above the national poverty rate, and green and blue states as below the national poverty rate.
Here are some takeaways I have from this data.
Poverty lower in Northern states, higher in Southern states
New York is the only truly Northern state with a poverty rate above 10 percent. Meanwhile, no Southern state has a poverty rate of 8% or lower. The prevalence of poverty between the North and South is stark in the United States.
Poverty is lowest in the Midwest
Likely as a result of the Supplemental Poverty Measure’s adjustment for regional cost of living, the Midwest experiences low poverty rates compared with the rest of the country. Missouri is the only Midwest state that has a poverty rate that exceeds 8 percent. The “Upper Midwest” subregion is home to five of the the U.S.’s nine states with poverty rates below 6 percent
The relationship between poverty and population growth is weak
Among the five fastest-growing states in the country, two (Idaho and Utah) have very low poverty, two (Montana and South Carolina) have middling poverty, and one (Florida) has high poverty. Among the fastest-shrinking states, poverty is more prevalent. Three states (Louisiana, New York, and West Virginia) have high poverty, one (California) has very high poverty, and only one (Illinois) has low poverty, though its poverty rate is still relatively high for the region.
Cost of living is a big factor in poverty
New England is a relatively low-poverty region of the country. The states with poverty above 8 percent in the region, Connecticut and Massachusetts, are both high cost of living states. Similar dynamics in New York and New Jersey drive the states higher despite being high-income states.
This factor also explains why California has the highest poverty rate in the country, the only state topping 13 percent poverty. High cost of living plunges many into poverty who would be able to live more comfortably elsewhere. This may be driving California’s heavy emigration to nearby states with more opportunity.
Data like this gives us an idea of the dynamics of poverty in the United States. We can see the relatively high poverty in subregions like Appalachia and the Deep South and relatively low poverty in the Upper Midwest and Pacific Northwest. It also gives us an idea of how policy is impacting poverty and which states need more work to reduce poverty rates.


