Poverty in the States: 2022

Last week, the U.S. Census Bureau released “Poverty in the United States: 2022,” its annual report on the data the bureau collects on income and poverty in the country.

One of the measures the Census Bureau estimates is the Supplemental Poverty Measure. This is a measure of poverty considered by most poverty scholars to be the most useful measure of poverty because it factors in taxes and benefits and makes adjustments for cost of living.

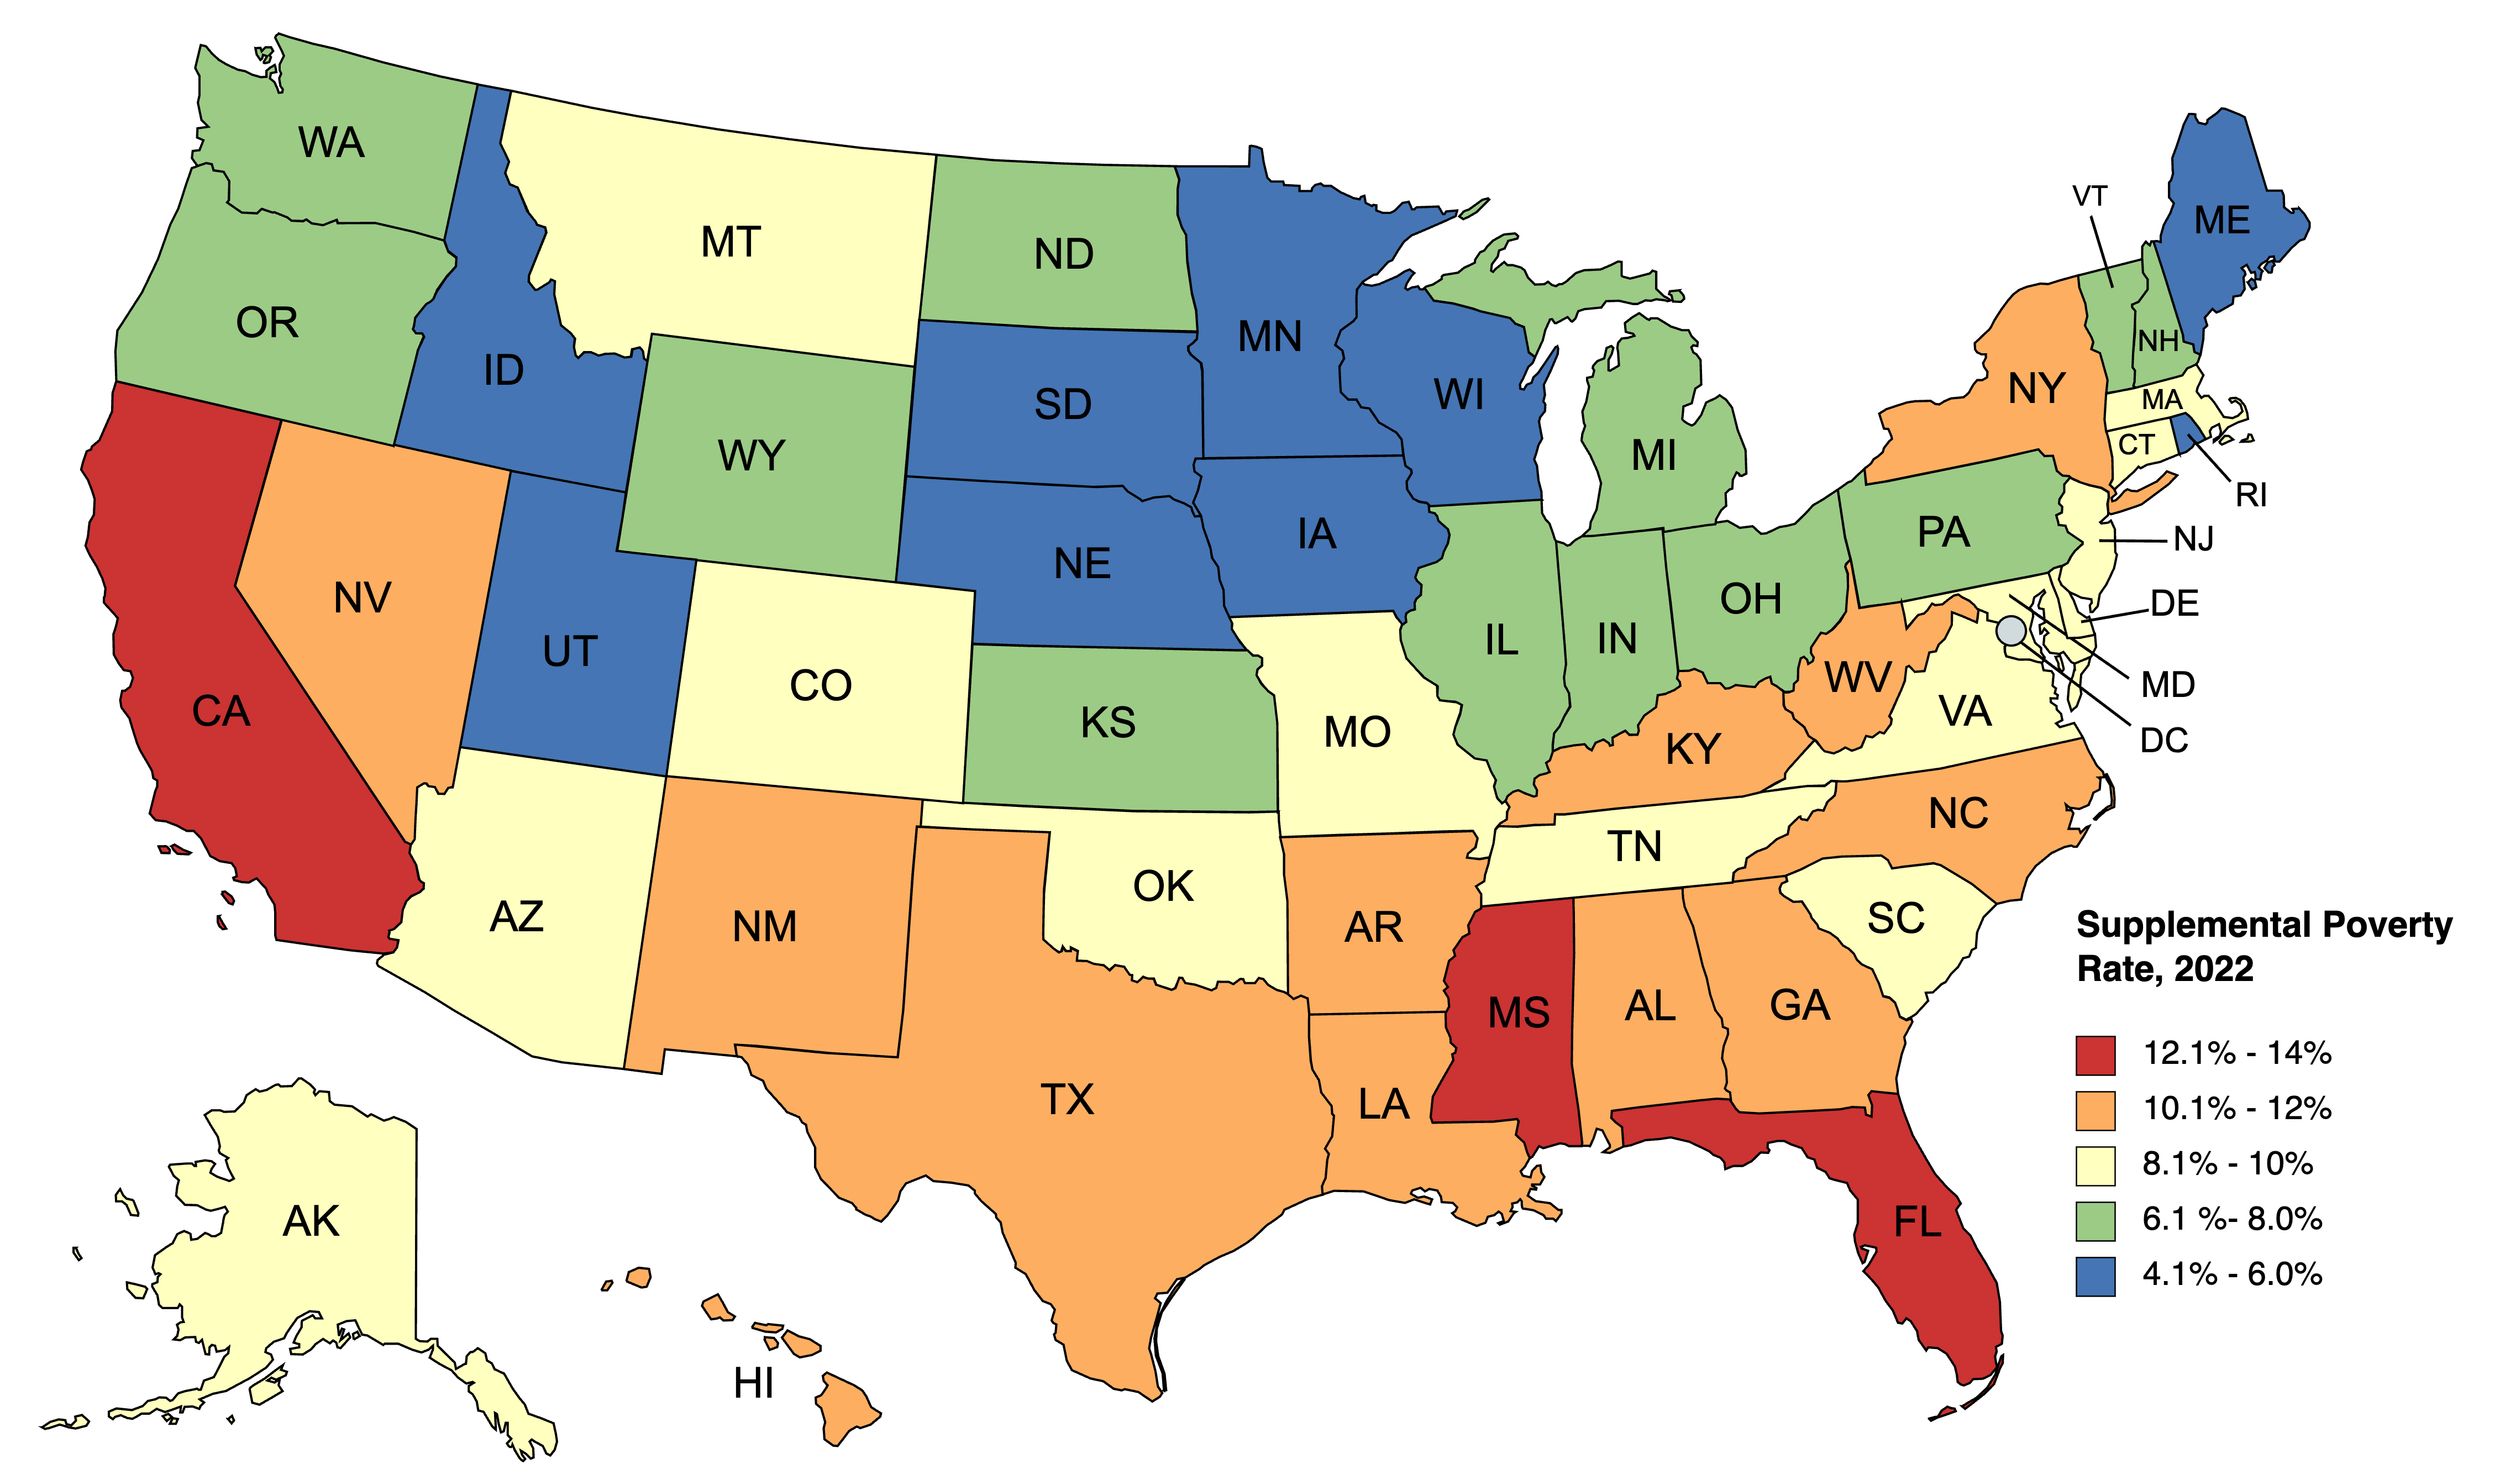
Below is a map of the fifty states color coded to the percentage of the population living in poverty according to the measure. The national poverty rate is 9.8%, so generally you can think of yellow states as close to the national poverty rate, orange and red states as above the national poverty rate, and green and blue states as below the national poverty rate.

Here are some takeaways I have from this data.

Poverty lower in Northern states, higher in Southern states

New York is the only truly Northern state with a poverty rate above 10 percent. Meanwhile, no Southern state has a poverty rate of 8% or lower. The prevalence of poverty between the North and South is stark in the United States.

Poverty is lowest in the Midwest

Likely as a result of the Supplemental Poverty Measure’s adjustment for regional cost of living, the Midwest experiences low poverty rates compared with the rest of the country. Missouri is the only Midwest state that has a poverty rate that exceeds 8 percent. The “Upper Midwest” subregion is home to five of the the U.S.’s nine states with poverty rates below 6 percent

The relationship between poverty and population growth is weak

Among the five fastest-growing states in the country, two (Idaho and Utah) have very low poverty, two (Montana and South Carolina) have middling poverty, and one (Florida) has high poverty. Among the fastest-shrinking states, poverty is more prevalent. Three states (Louisiana, New York, and West Virginia) have high poverty, one (California) has very high poverty, and only one (Illinois) has low poverty, though its poverty rate is still relatively high for the region.

Cost of living is a big factor in poverty

New England is a relatively low-poverty region of the country. The states with poverty above 8 percent in the region, Connecticut and Massachusetts, are both high cost of living states. Similar dynamics in New York and New Jersey drive the states higher despite being high-income states.

This factor also explains why California has the highest poverty rate in the country, the only state topping 13 percent poverty. High cost of living plunges many into poverty who would be able to live more comfortably elsewhere. This may be driving California’s heavy emigration to nearby states with more opportunity.

Data like this gives us an idea of the dynamics of poverty in the United States. We can see the relatively high poverty in subregions like Appalachia and the Deep South and relatively low poverty in the Upper Midwest and Pacific Northwest. It also gives us an idea of how policy is impacting poverty and which states need more work to reduce poverty rates.

Ohio economists think lawsuits against oil and gas companies would have benefits for society

In a survey released this morning by Scioto Analysis, a majority of Ohio economists polled said that cities and the state of Ohio would increase social welfare if they sued oil and gas companies to pay damages for concealing the effects of climate change. 

One economist who agreed was Jonathan Andreas from Bluffton University, who wrote “A lot depends on how we trade off present welfare (which might decrease) versus future welfare (which would hopefully increase).” He goes on to point out that whether or not present welfare decreases depends on how Ohio’s energy market changes. Because Ohio is a net exporter of natural gas but a net importer of other fossil fuels, this effect is somewhat uncertain. 

Additionally, a plurality of economists surveyed agreed that these lawsuits could help reduce inequality, though many respondents were uncertain. 

One economist who was uncertain, Faria Huq from Lake Erie College, wrote “Economically disadvantaged groups tend to be disproportionately affected by the effects of climate change, and suing oil and gas companies would help pay for some of the costs of climate change. However, if the companies passed on some of these costs to consumers in the form of higher prices, in the short run, people with lower incomes may end up having to spend a larger proportion of their incomes on these essential utilities.”

This survey comes days after California became the most recent state to file a lawsuit against oil and gas companies. Previous suits have been filed at all levels of state and local government, such as Multnomah County in Oregon and the city of Honolulu, Hawaii. 

The Ohio Economic Experts Panel is a panel of over 40 Ohio Economists from over 30 Ohio higher educational institutions conducted by Scioto Analysis. The goal of the Ohio Economic Experts Panel is to promote better policy outcomes by providing policymakers, policy influencers, and the public with the informed opinions of Ohio’s leading economists. Individual responses to all surveys can be found here.

Census Bureau releases new poverty numbers

On Tuesday, the U.S. Census Bureau released its annual report on the state of poverty in the United States. Every year, this is the biggest moment in poverty statistics as we get a snapshot of what poverty looked like in the previous year.

While statewide information is forthcoming, with the national numbers we can come away with some important takeaways.

Household incomes are down in 2022

Inflation took a bite out of household incomes as their real value dropped compared to 2021. The silver lining on this measure is that incomes were steady for Asian, Black, and Hispanic households, though they were still substantially lower for Black and Hispanic households than for non-Hispanic whites.

Inequality is down in 2022

For the first time since the Great Recession, the U.S. Gini coefficient, a measure of inequality across the income distribution, decreased in 2022. This could be because inflation pressures hit upper-income households harder than they hit lower-income households.

Poverty before counting benefits is steady

The census bureau estimates 38 million Americans lived in poverty in 2022, 12% of the total population. Neither of these numbers were substantially different from the 2021 numbers.

Black poverty dropped to a historic low

The official poverty rate for Black households dropped from 2021 to 2022. This was its lowest rate on record.

Poverty after counting benefits shot up

2021 was an important year because poverty after counting taxes and public benefits hit a record low. This was due to expansion of the Child Tax Credit and other income supports put in place during the COVID-19 pandemic. 

After Senator Joe Manchin decided he would not support making the child tax credit permanent, the program expired at the end of 2022. This led to the largest single-year increase in poverty after counting benefits, a 4.6 percentage point increase.

Child poverty after counting benefits more than doubled

The decision to end the child tax credit expansion unsurprisingly fell hardest on children. Child poverty after counting taxing benefits lept from 5% in 2021 to 12% in 2022 largely due to expiration of the child tax credit expansion.

So what can we do with this information? Policymakers at the state level have tools to fight poverty.

They can expand the earned income tax credit. The earned income tax credit is the largest anti-poverty program in the country after social security and Ohio has a state-level version of the credit. By expanding the amount of cash this gives to low-income working households, this could take a bite out of state level poverty.

Lawmakers can ensure access to food assistance. The federal government gives states significant leeway to control eligibility for SNAP (formerly “food stamp”) assistance and eligibility for free or reduced breakfast and lunch programs in schools. Both of these are programs paid for by the federal government that keep millions across the country out of poverty. By allowing access to these programs, Ohio can help keep people out of poverty.

If lawmakers really want to tackle poverty, the way to do that would be through basic income. Programs like a negative income tax have been considered in the United States for half a century and were utilized during the pandemic. The most straightforward way to fight poverty is to provide people with income.

Poverty is a policy choice, and one that can be made at the state level. Let us hope that someday policymakers will see it as a priority.

This commentary first appeared in the Ohio Capital Journal.

How can we make taxes more equitable?

Taxes are one of the most important tools policymakers have at their disposal to change the way our society works. They can correct market failures, they are important for financing critical public goods and services, and almost everyone hates them.

There are a lot of opinions out there about exactly how our taxes should be structured, but one thing most people can agree on is that regressive taxes are often undesirable. As a reminder, regressive taxes are those where people with lower income end up paying a greater percentage of their income on the tax. 

The opposite of regressive taxes are progressive taxes, where as income increases people end up paying a higher percentage of their income on the tax. The most well known progressive tax is income tax, where increasing tax rates are specifically part of the structure. 

Progressive taxes are good because they are often one of the most effective tools for reducing inequality. This is because lower-income individuals often receive a bigger portion of the benefits from public goods and services. When a higher percentage of the funds that pay for those programs comes from higher income individuals then inequality should fall. 

One issue with income taxes in particular is that as people get wealthier, they tend to rely less and less on wages as their primary source of income. Instead, the ultra wealthy tend to have a much higher percentage of investment income compared to everyone else. 

Through strategies such as “buy, borrow, die” the ultra wealthy are effectively able to dodge paying capital gains taxes on their investments, allowing them to maintain an extremely high level of consumption without paying nearly as much in taxes as if they were being paid an extremely large salary. 

One solution to this loophole proposed by the Tax Policy Institute is to institute a value added tax (VAT) and use it to finance a universal basic income (UBI) program. Researchers have estimated that such a program would increase the after-tax income of the poorest 20% of households by 17 percent. 

And because a VAT is a tax on consumption, everyone who consumes is liable for taxes relative to how much they consume.

This is a great example of excellent policy analysis practice. There is an identifiable problem (the ultra wealthy are largely able to avoid being taxed despite having high levels of consumption), an interesting solution (VAT), and a quantifiable outcome showing the impacts across the income distribution.

While it’s possible for a state to add a VAT to their tax code, a policy change that significant is much more likely at the federal level. What State and local policymakers should try and take from this study is an understanding of just how valuable progressive taxes can be. 

Assuming those funds are earmarked for programs that have high returns on investment, especially if they benefit lower income households, progressive taxes can do a lot of heavy lifting on reducing inequality.

What’s the matter with zoning?

Conversations in Columbus, Ohio have been brewing for years about an overhaul of the city’s 70-year-old zoning code.

City officials are now saying they will likely vote on a large reform package this spring. While zoning, or restriction of land for particular uses, feels as American as apple pie, the institution is only an invention of the 20th century. The first zoning code was adopted in Los Angeles in 1904 and it was only affirmed as constitutional in a 1926 case involving the village of Euclid, Ohio.

While setting certain land aside for certain uses seems reasonable on its face, researchers have found some negative side effects to strict zoning codes.

Increased cost of housing

The most well-documented effect of strict zoning is the impact it has on the cost of housing. One 2018 study found that the implicit “tax” on housing levied by zoning exceeds the public costs levied by new construction.

This means housing is made more expensive than needed for an efficient housing market due to zoning because it limits the ability for enough housing to be created to meet demand.

Another study looked at the supply of housing in markets in the United States with strict zoning rules, finding supply could not keep up with demand in those markets. Still another study attributes much of the growth in United States housing prices over the past forty years to zoning restrictions.

Homelessness

Strict zoning can also have an impact on the most vulnerable. More land use restriction means less available housing for those who need it. A study earlier this year by a University of Maryland researcher found that cities with more restrictive zoning rules experienced higher rates of homelessness. This is because it reduces the amount of available housing and increases its price, pricing some people out of the market for housing altogether.

Economic and Racial Inequality

Zoning is a powerful tool for shaping the socioeconomic landscape of a city. A growing body of research suggests neighborhoods can have substantial impact on future outcomes for children.

Some have argued that zoning allows people in power to concentrate wealth and lock others out of neighborhoods.

This pattern of policymaking can also lead to instances of de facto racial segregation. Some scholars argue this was part of the historical justification behind zoning in the first place.

Restrictive zoning used side by side with redlining is an effective tool for enforcing de facto racial segregation.

Economic Growth

A clear impact of restricting use of land is that people cannot react to changes in needs quickly. If a neighborhood was once a good candidate for industrial development but now is much more attractive as a residential area, zoning needs to move faster than developers to keep up pace or people will not be able to live in these areas. This means strict zoning laws can put a damper on growing local economies or make it difficult for more sluggish local economies to adapt.

Some cities, like Columbus, are taking the lead on zoning reform. But this reform can also be led at the state level. California, Connecticut, Massachusetts, and Oregon have all passed legislation mandating looser zoning at the local level. Utah had an innovative solution, appropriating funds for local governments to use for local zoning reform.

Zoning reform has the potential to be a place where people can make compromises across the aisle. Reform of zoning appeals to free-market adherents and advocates for racial justice. If we can grow our economy and make it more equitable at the same time, what is there to lose?

This commentary first appeared in the Ohio Capital Journal.

Why air conditioning in schools matters

One of the main reasons I love living in Minneapolis, Minnesota is that it is often colder than most other parts of the country. I personally prefer fall colors and the thrill of winter sports to sandy beaches and the ocean breeze. 

This year, however, the summer heat has stuck around much longer than it normally does. Only six days into September we have had four days where the high temperature has been at least 90 degrees. For reference, last year there was only one day in September that met that mark. 

As someone who lives in a house that doesn’t have air conditioning, this made the holiday weekend much less pleasant.

My discomfort aside, the fact that a heatwave of this magnitude has hit the Midwest this late in the year is a troubling sign. One of the main reasons we should be worried is that students are coming back to schools that have historically been able to get by without AC during this time of year.

A report from the US Government Accountability Office found that in 2020, over 40% of school districts needed to update or replace HVAC in at least half of their schools. 
High temperatures are more than just an inconvenience for students. Studies have shown that an increase in the number of hot days can decrease test scores and overall academic achievement

Of particular concern is how hot days disproportionately affect minority students because they often attend schools in poorer districts with less funding. This means that as our climate continues to heat up, we might see gaps in educational attainment widen unless something is done. 

Also of concern is when summer temperatures begin at the end of the school year when students are taking final exams. One study from 2016 found that students were 11% more likely to fail an exam if they took it on a 90 degree day compared to a 70 degree day. 

Policymakers should be concerned about the temperatures students are exposed to. It is a major financial investment, but in the face of climate change, public schools across the country will need to improve their air conditioning systems or suffer worse outcomes for children. Temperatures are going to continue to increase, and a larger portion of the school year is going to require cooling for students to get the full benefit of their education. 

Air conditioning is also going to be required to keep students safe during the day. The worst case scenario would be if students began experiencing forms of heat related illness such as heat exhaustion or heat stroke during the school day.

This is not to suggest that schools failing to install air conditioning is going to necessarily lead to poor health outcomes, but it does make the margin for error around student health smaller. At the very least, this will require teachers and other school personnel to keep an eye out and make sure students have enough access to water and appropriate clothing. 

The reality of the next few decades is that average temperatures across the world will rise. All across the world, people are going to have to adapt to hotter days. Schools present an interesting public challenge because their schedule has historically kept them safe from the worst of the summer heat. Policymakers need to understand that this gap exists and work to close it quickly.

How to apply behavioral economics to policy analysis

Earlier this year, the National Academies of Science, Engineering, and Medicine released a new report detailing how insights from behavioral economics can be applied to a policy context. 

Behavioral economics is a sub-branch of economics that focuses on understanding why humans make the choices they do, specifically in situations where classical economic models fail. Sitting at the intersection of classical economics and psychology, behavioral economics is especially suited for quantitatively measuring seemingly irrational actions.

One of the key takeaways from the report is five behavioral principles that the National Academies identified as having a strong influence on people’s decision making. Understanding these principles is key to designing good policy options. 

Limited Attention and Cognition

Humans only have a limited ability to process information. This is a problem for classical economic models that often assume that all parties have perfect information and are perfectly rational. 

For policy analysts, this means we should be careful when using research that relies on individuals' attention and cognition, as the results might not hold in a new context. Policymakers should attempt to focus on policies that are as simple as possible and don’t require a great deal of understanding in order to be effective. 

One example of this is the market for health insurance plans. In theory, it might seem optimal to have a massive amount of options so everyone can tailor their plan to meet their specific health needs. But often consumers do not have the time or energy to fully understand different plans and they end up with sub-optimal outcomes.

Inaccurate Beliefs

People make mistakes. We might mistake spurious correlations as causal trends, misread a question on a survey, or we might over/underestimate the severity of a problem. This is often the result of our limited attention and cognition, but the result is that sometimes it is worthwhile for policies to come with education in order to make sure everyone is on the same page.

For example, some people may overestimate the probability of dying in a terrorist attack and underestimate the probability of dying in a car crash. This can lead to a market failure where people were spending more resources than they need to prevent terrorist attacks and less resources preventing car crashes. 

Present Bias

People tend to focus on what is in front of them. It is much harder to fully understand the effects of a policy if it takes years for them to come into place. In policy analysis, we partially represent people’s preference for the short term by discounting future benefits. 

Still, discounting relies on the assumption that there is some uncertainty about the future that we need to price into our estimates. Present bias implies that people tend to prefer short term rewards beyond what would be optimal given their preference for risk. 

It is important that policymakers take a step back and see the bigger picture. Some policies like early childhood education don’t have payoffs until generations later, but their impacts can be so massive that they should still be prioritized. 

Reference Dependence and Framing

Humans tend to make risk decisions based on a particular reference point rather than evaluating all possible options. For example, a policymaker might believe the best way to improve test scores in a school might be to increase the number of teachers, while missing a more creative and effective solution like ensuring students have enough food to eat outside of school hours. 

When discussing policy options, both analysts and policymakers need to be careful that they are exploring all possible alternatives. 

Social Preferences and Social Norms

People tend to make decisions that conform with social norms. Asking people to break social norms is very difficult, and would presumably require more effort than asking people to conform. 

From a policy perspective, this suggests that we should look for policies that are designed in such a way that they either align with social norms, or create new norms. For example, if we want to encourage people to recycle, then it would probably be more effective to drop off bins at every house as opposed to making them free to those who ask. 

Policymakers and analysts need to make sure that they are considering behavioral economics each time they approach an issue. Doing so will help us design more effective and efficient policies, as well as making it more likely that people will respond to policies in a predictable way.

How much does a ton of carbon cost?

The social cost of carbon is probably the most important statistic in the economics of climate change.

Estimating the social cost of carbon is an ambitious undertaking. Using projections for future emissions based on population, economic growth, and other factors, economists attempt to estimate how temperature increases and sea level rise will impact agriculture, health, energy use, and other social impacts in the future. They then monetize these impacts and discount them to present dollars and come up with a single estimate of the social cost of the release of a ton of carbon into the atmosphere.

This leads to a single number that tells us how much carbon emissions cost our economy.

This number is important because regulators use it to estimate the benefits of federal interventions that reduce carbon emissions. This means that a higher social cost of carbon will lead to more policies being deemed to have net economic benefits and a lower social cost of carbon will lead to more policies deemed to have net economic costs.

The social cost of carbon is also the implied efficient price for a carbon tax, so it has direct relevance for policy design as well.

These two reasons, the difficulty of calculating and the public policy importance of the measure, have led to a number of different estimates of the social cost of carbon. Below are some of the estimates that have existed over the years.

$1

The Trump Administration estimated the social cost of carbon could be as low as $1 per metric ton of carbon emitted. The estimate the Trump Administration made was based on domestic impacts alone, ignoring international impacts. While this is not an analytically unsound way to calculate the social cost of carbon, it does overlook a clear political problem with climate change: collective action. 

The goal of the Paris Agreement was to get the international community to get on the same page about carbon emissions. This is because everyone in the world suffers if carbon emissions are not abated. Endorsing a social cost of carbon so low was a message rejecting the notion that the United States had any intention to cooperate with the international community in abating carbon emissions and reducing the severity of global climate change.

$37

The Obama Administration was the first federal administration to officially put a price on carbon emissions at $37 per metric ton in 2015, with the value increasing over time. This number was groundbreaking as the first social cost of carbon adopted by a federal administration, but was soon replaced by the Trump Administration estimate.

$51

The recent estimate of the social cost of carbon from the Biden administration was $51, using similar methodology to the social cost of carbon estimated by the Obama administration. This was a substantial change from the Trump Administration number but still on the low end of what mainstream climate economists were estimating at the time.

$190

The current proposal from the Biden Administration brings the social cost of carbon closer to academic estimates of the social cost of carbon. While this estimate is less than a year old, it stands as the highest estimate of the social cost of carbon by a federal administration. This number brings the estimate closer to a September 2022 article in Nature that estimated the social cost of carbon at $185 per metric ton of CO2.

$305

Some estimates of the social cost of carbon in the academic literature exceed $300. A recent study put its estimate at $305-312 per metric ton of carbon dioxide.

On the opposite side of the Trump Administration figure, a high social cost of carbon implies a responsibility for the United States to be a leader in curbing carbon emissions. Some could see this as the United States taking on more of its responsibility than it should, while others could see it as the United States taking its part in ameliorating a global problem.

If a federal or state administration puts the social cost of carbon at $1 or $305, it can have a big impact on public policy. A direct tax on carbon of $1 per metric ton of carbon dioxide versus $305 per ton would have drastically different impacts on the economy. And the indirect impacts of evaluating regulations under these different costs could be large as well. These estimates matter and care should be taken to make sure that we have a good handle on the true cost of carbon emissions to the economies of future generations. 

Analyst perspective: who really pays for taxes?

In our work as policy analysts, we rely heavily on some of the fundamental theories of economics in order to determine the value of impacts. This has recently come up in a research project we are currently working on, where we need to estimate the elasticity of demand for a good in order to understand what the effects of an excise tax will be. In particular, we are looking at the market for recreational marijuana.

Briefly, the elasticity of demand (or supply) is a numerical measure of how much effect a change in price has on the quantity demanded. For example, if a 1% increase in the price leads to a 2% decrease in quantity demanded, then we say a good has a demand elasticity of -2. 

There are many important results that we can derive from elasticities, but I want to focus on how they interact with taxes. Consider a competitive market for a good that we want to tax:

We can see in our simple setup that the demand curve is much steeper (more inelastic) than the supply curve. Intuitively, this means that changes in price have little effect on the quantity demanded. Conversely, the supply curve is quite flat, suggesting that a small change in price would have a large effect on the quantity supplied. In the above picture, the new tax we are adding to this market is represented by the vertical dotted line, often called the tax wedge. 

Because demand is more inelastic than supply in this market setup, the consumers of this product will have a higher tax incidence. In other words, a larger percentage of this tax will get passed onto them. If we assume that this is a flat $10 tax per item sold, then this tax might  cause the price consumers pay to rise by $8 (the suppliers eat the other $2 via lost revenue).

Who ends up paying for taxes is an interesting question in its own right. In our forthcoming cost-benefit analysis of recreational cannabis legalization in Ohio, this matters to us because we need to fully understand how the proposed excise tax will impact consumer surplus.

As a reminder, consumer surplus represents the difference between the cost of a good in a market and people’s willingness to pay for that good. If people are willing to pay large amounts, but the market price for a good is very cheap, then there is large consumer surplus. People are getting a lot of value for the price they pay. 

In our model for the benefits of legalizing recreational cannabis, one of the major components is going to be how much consumer surplus is generated in a regulated and taxed market. In order to accurately estimate this, we will need to know about the elasticities in our market so that we can accurately assign the tax incidence. 

In practice, this is going to require empirical data. There are econometric methods for estimating supply and demand curves, and because many other states have legal cannabis markets we should have some data to work with. 

Hopefully, we can accurately predict the shape of the recreational cannabis market in Ohio. Then, it will be up to the voters to decide whether they want this market to exist in November.

Three steps for analyzing equity in public policy

Earlier this month, Scioto Analysis released an analysis we did in partnership with the Center for Climate Integrity on the cost of climate change in Pennsylvania.

In this study, we built on the work we did on our Ohio cost of climate change report to estimate how climate change will impact different types of communities.

A lot of lip service is paid to “equity” in public policy analysis these days. Equity is one of the “big three” criteria for analyzing public policy along with effectiveness and efficiency. But unlike effectiveness analysis, which has tools like randomized controlled trials and quasi experimental methods, and efficiency analysis, which has cost-benefit analysis, equity analysis has no go-to methodology for its conduct.

So how do we conduct equity analysis? The steps we took ended up looking a lot like a broader policy analysis. While you could go through the steps of the Eightfold Path to conduct an equity analysis, our approach in this study boiled down to three major steps.

Step 1: Define Criteria

One of the major reasons equity analysis is not as standardized as effectiveness or efficiency analysis is because of the many dimensions equity can be analyzed on. Race, income, sex, rurality, age, education, sexual orientation, geography, employment, immigrant status, language spoken at home, and housing are just a handful of different examples of dimensions of equity.

Criteria should be defined based on (a) what is informative to your client, (b) what you have reliable data on, and (c) what is relevant to the content of the study. 

The former consideration is always paramount in public policy analysis: what will people listen to? When speaking truth to power, an analyst needs to be aware of what her client is interested in and what she will listen to if policy analysis is to be useful.

Also important is whether data is available. A client might be eminently interested in how their policy impacts high-IQ students, but if the data is not available on how those students are impacted by the policy, an analyst is not very useful.

Step 2: Calculate Impacts

This is the “technical” part of the analysis. This phase of equity analysis consists of gathering data and estimating what the range of impacts are for different groups. 

For our Pennsylvania analysis, we had defined municipalities as municipalities of interest based on them having larger racial minority, impoverished, rural, non-English-speaking, or foreign-born populations. We then calculated what these communities’ per-capita costs were compared to the per-capita costs of the average municipality statewide.

Step 3: Communicate Results

Policy analysis requires good communication, and equity is no exception to this. Communication of equity results can demand extra care because of the sensitive political dynamics associated with communities of interest defined by equity categories. Knowing the right language to use around race, income, and gender is tantamount, especially when making sure a client will take this analysis seriously.

Also important is making sure that results are communicated in a way that transparently and clearly shows the differences between equity categories. In our results, we showed the dollar figure difference between communities. This showed how much different communities would have to pay based on the type of community they were.

When all was said and done with this study, we found that high-poverty and rural municipalities would pay more per-capita than the average Pennsylvania municipality. This was a useful insight: it told us something about who will shoulder the burdens of the cost of climate change. And this is just the sort of insight that helps us understand who will benefit from policy interventions.